There is a comfortable story about the present moment. The world is unusually dangerous, the danger will pass, and the portfolio that worked for the last thirty years will work again once it does. I have spent the past few months working through the primary data on that middle clause, and I do not think it holds.
What follows is the case, and then the part that matters more for most of the people I speak to: what it is costing to stand aside while the argument is settled.
The regime changed, and you can measure it
The Geopolitical Risk Index, built by Dario Caldara and Matteo Iacoviello at the Federal Reserve Board, counts how often ten major newspapers reference adverse geopolitical events, normalised so that the 1985 to 2019 average sits near 100. August 2026 printed 118. Glance at that and you would conclude the world is fine.
The level is the wrong statistic. The distribution is the story.
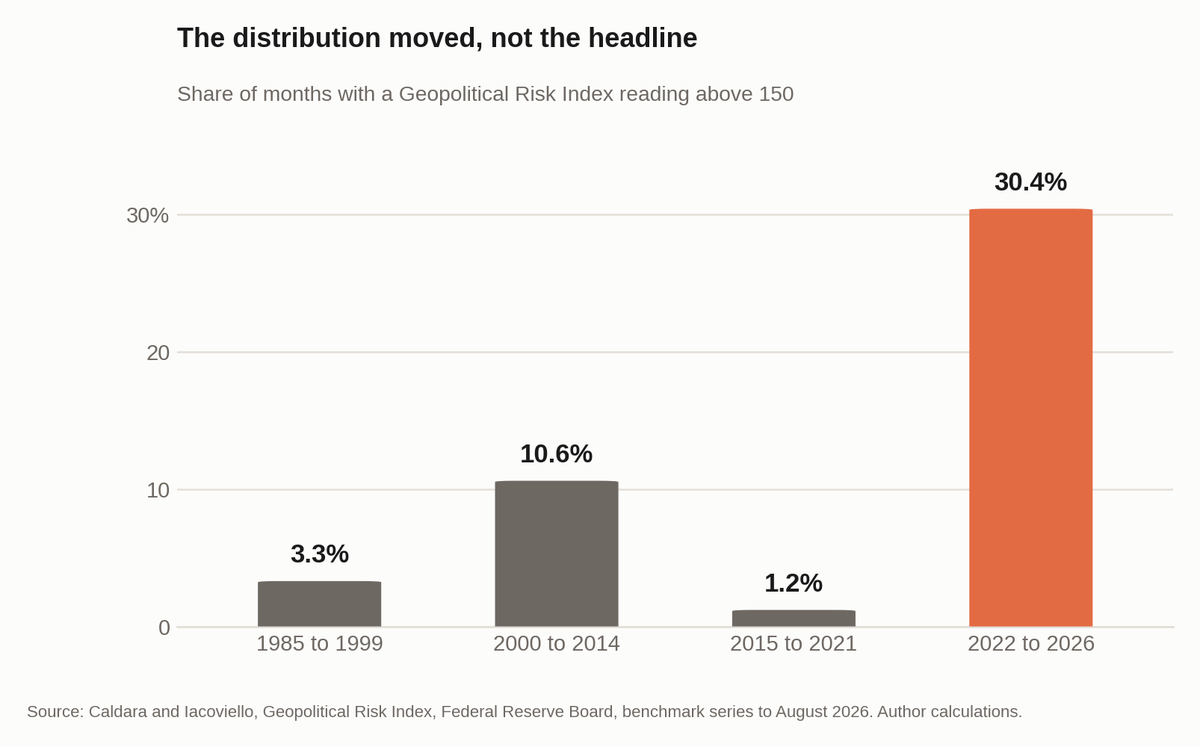
Between 1985 and 1999, 3.3 per cent of months printed above 150. Between 2015 and 2021, the window in which most current portfolio models were calibrated, it was 1.2 per cent. Since January 2022 it has been 30.4 per cent. The average has risen by about half. The frequency of extreme months has risen by a factor of twenty-five against the period that shaped how most portfolios are built. That is what a volatility regime change looks like: a modest shift in the mean and a very large shift in the tails.
2026 is running at a calendar-year average of 192. That is the highest annual average in the benchmark series since it begins in 1985, above 2003 and above 2001.
Three separate datasets say the same thing
One index proves nothing. Three, built by different people on different source material, are harder to wave away.
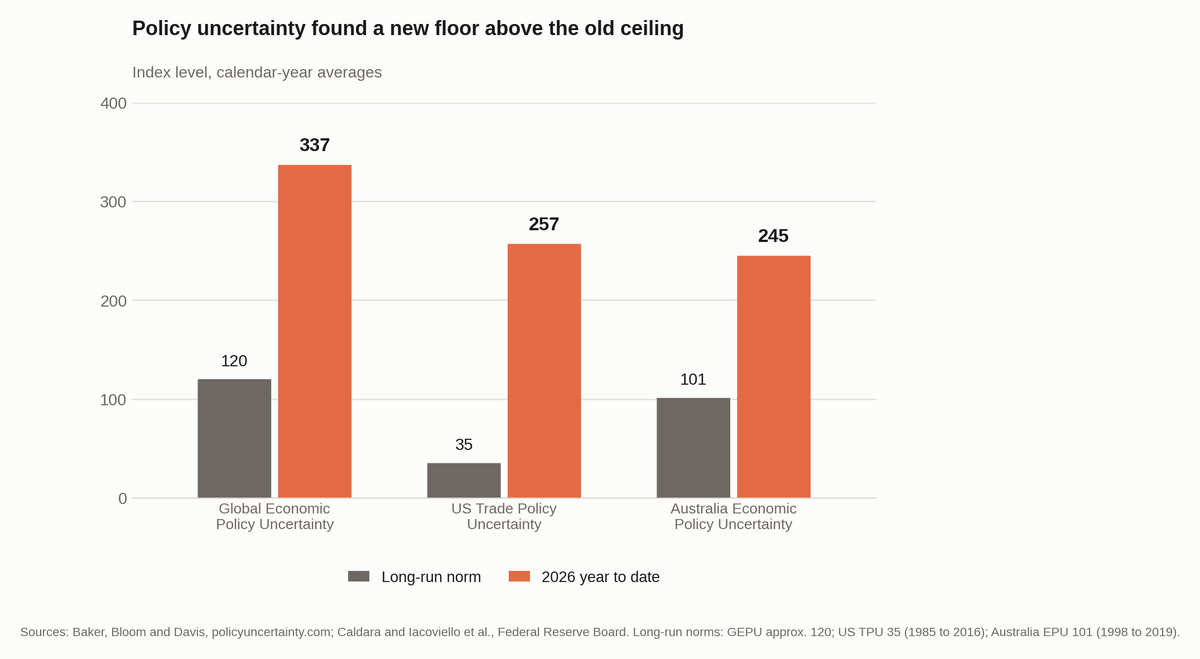
Global Economic Policy Uncertainty averaged 395 in 2025, the highest calendar year on record and well above the pandemic year. United States trade policy uncertainty averaged 538 against a 1985 to 2016 average of 35. Even after the tariff news cycle faded it has settled near 257, still more than seven times its pre-2017 norm. It has not reverted. It has found a new floor several times above the old ceiling.
Newspaper indices are a proxy, so here are counts instead. Uppsala University recorded 65 state-based armed conflicts in 2025, the most since its series begins in 1946. Eight of those were between states, up from two in 2023. Interstate conflict is the category that matters for markets, because wars between states close shipping lanes, trigger sanctions regimes and redirect capital flows. Civil conflicts are humanitarian catastrophes that are frequently irrelevant to asset prices.
And governments are voting with their balance sheets. World military expenditure reached US$2,887 billion in 2025, an eleventh consecutive annual increase. European spending rose 14 per cent in a single year. Procurement cycles run five to fifteen years and industrial capacity takes a decade to build, so a commitment made in 2025 is a cash flow running through to 2040.
Four engines that do not switch off
A volatility event is something you ride out. A regime change is something you rebuild for. The distinction has to be made on mechanism rather than on mood, so here are the four I keep coming back to. Each has a capital cycle measured in decades, and none of them stops when the Strait of Hormuz reopens.
- National security has become a whole-of-economy line item. NATO members committed at the 2025 Hague Summit to 5 per cent of GDP by 2035, against a 2 per cent benchmark that dated from 2014, and the modern definition covers cyber, ports, energy infrastructure and the industrial base that supplies them. This is an industrial capital expenditure cycle that happens to be authorised by defence ministries.
- Electricity is the binding constraint on everything else. United States electricity demand was flat for three decades and is now projected to grow 40 to 60 per cent over ten to fifteen years, on a grid that is forty to fifty years old. Data centres, electrification and reshoring all arrived at once.
- Fiscal capacity is exhausted just as the bills arrive. United States federal debt held by the public passes 100 per cent of GDP during 2026, the first time since 1946. When the sovereign is itself a source of risk, private capital becomes the financing mechanism by default and the term premium has to rise.
- Artificial intelligence, framed honestly. The productivity gain is not yet visible in the data. The capital spending very much is, and if the productivity does arrive, the textbook consequence is higher real rates, not lower. Most investors have that the wrong way around.
Put those together and you get an economy with a structurally higher demand for capital, and therefore a structurally higher cost of it. I am not making a directional inflation call, and I would distrust anyone who does. The narrower point is that the balance of structural forces has changed sign against the 1994 to 2020 period, and a portfolio built on the assumption that every shock is disinflationary and every crisis brings rate cuts is built on the wrong regime.
So people go to cash. Here is the bill.
This is where I part company with most of the commentary on this subject, because the honest conclusion from everything above is not defensive.
The RBA cash rate is 4.35 per cent after three rises this year. Trimmed mean inflation ran at 3.6 per cent over the twelve months to July, above the target band and re-accelerating. Before tax, cash is earning a real return of 0.75 per cent. Nobody holds cash before tax.
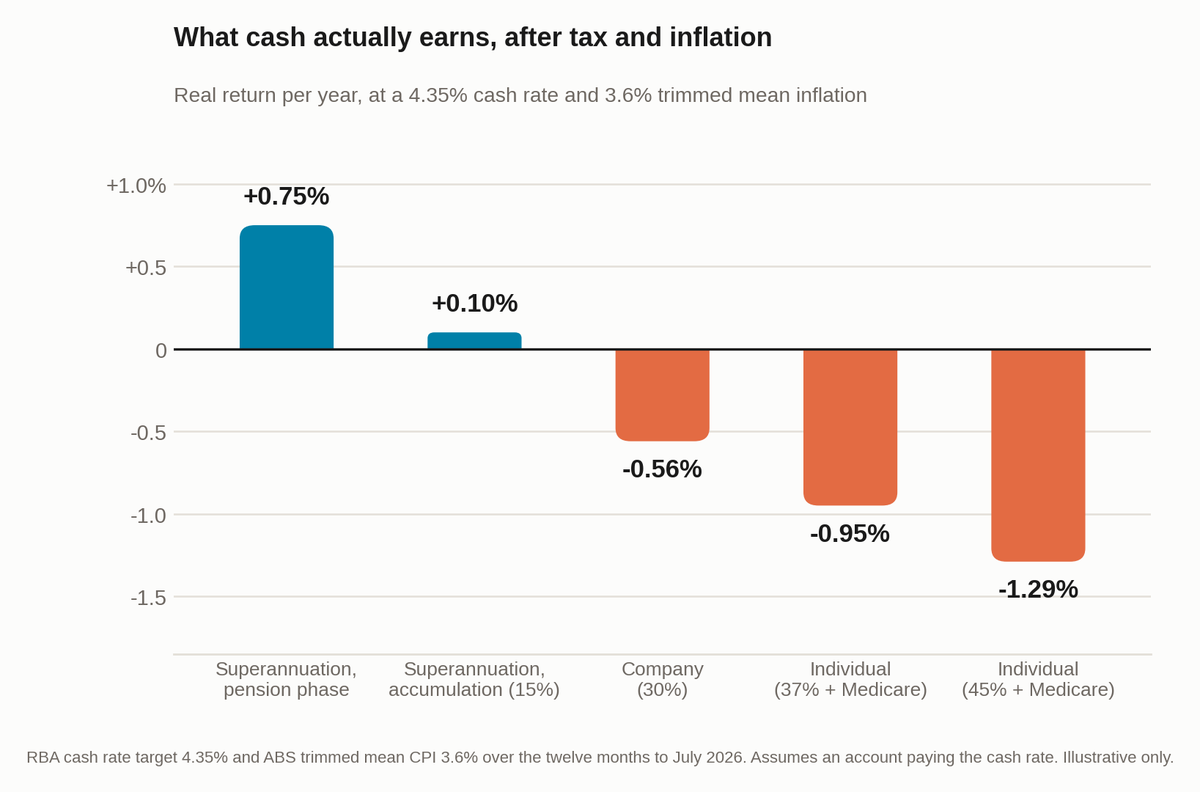
| Who is holding it | Before tax | After tax | Real, per year |
|---|---|---|---|
| Superannuation, pension phase | 4.35% | 4.35% | +0.75% |
| Superannuation, accumulation (15%) | 4.35% | 3.70% | +0.10% |
| Company (30%) | 4.35% | 3.05% | −0.56% |
| Individual (37% + Medicare) | 4.35% | 2.65% | −0.95% |
| Individual (45% + Medicare) | 4.35% | 2.31% | −1.29% |
Assumes an account paying the RBA cash rate target of 4.35 per cent, against ABS trimmed mean CPI of 3.6 per cent over the twelve months to July 2026. Standard Australian marginal rates including the Medicare levy. Illustrative only. Your own position will differ and you should seek tax advice.
A client on the top marginal rate earns 2.31 per cent after tax on an account paying the cash rate, against inflation of 3.6 per cent. That is minus 1.29 per cent a year in purchasing power, with something close to certainty, for as long as the money sits there. A company at 30 per cent loses 0.56 per cent. Superannuation in accumulation phase is roughly line ball. Only pension phase is meaningfully ahead, and only by 0.75 per cent.
Worth saying plainly: cash is the only position in a portfolio whose loss is close to arithmetically certain rather than probabilistic. Equities might fall. Cash at these levels, for most holders, definitely erodes.
The compounding version
One year of minus 1.29 per cent is easy to dismiss. It is the compounding that does the damage, and it is invisible because nobody sends an invoice for it.
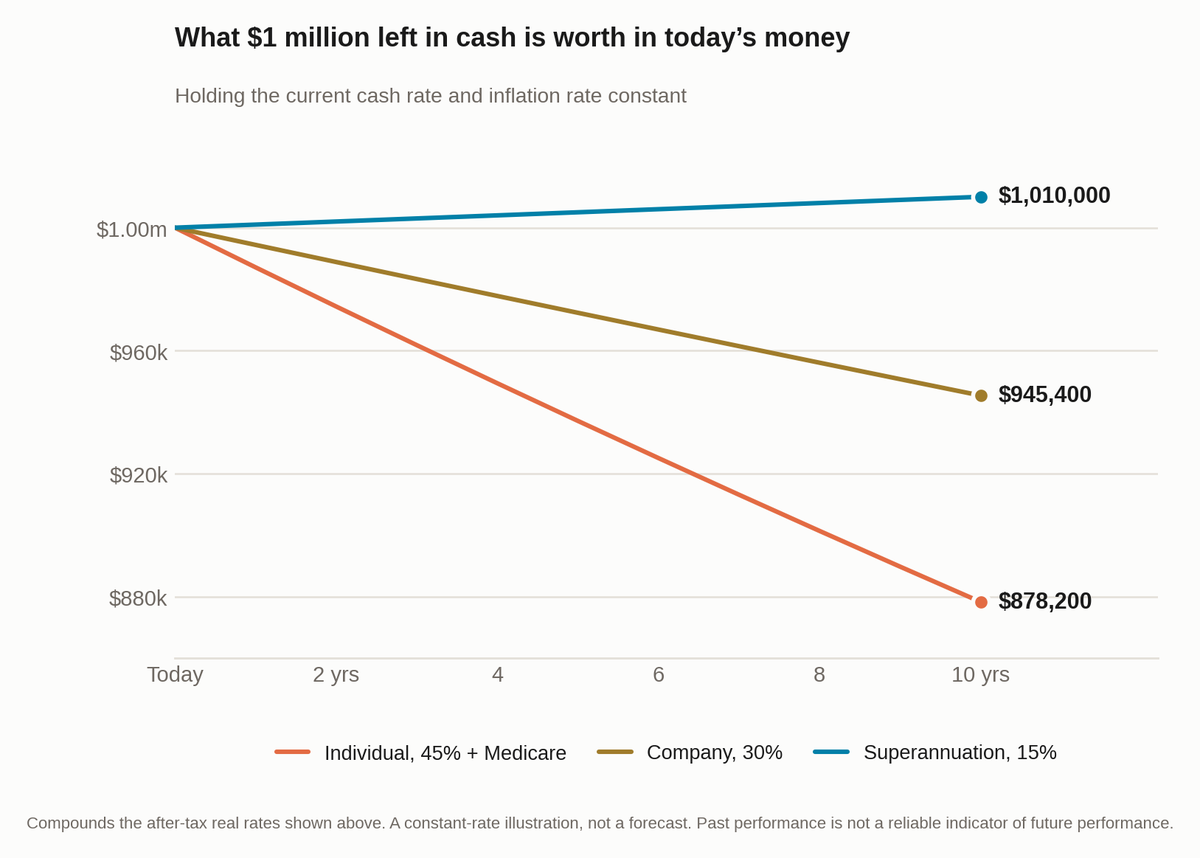
On $1 million held by a top-rate individual, that is roughly $12,900 of purchasing power in the first year, about $63,000 over five years and about $122,000 over ten. Held in a company, about $54,000 over ten years. There is no line on any statement that shows it. The balance looks the same. It simply buys less.
Cash is only dry powder if it has a written job
I want to be careful here, because the argument is easy to caricature. I am not against holding cash. I hold it for clients deliberately, and in this regime I want more of it than I did in 2021, not less. The distinction is what the cash is for.
Dry powder is cash with a written job: a named asset, a trigger a third party could observe, a size, and a source of funds, all decided before the event. In a regime that produces more frequent dislocations, that cash is being paid for optionality, and the value of that optionality has risen precisely because the tails have fattened. 2026 has already thrown up several occasions to use it. An emerging market equity drawdown of more than 12 per cent in late February and March. An energy complex that repriced by more than 60 per cent. A sovereign bond market that repriced a full percentage point of term premium. Each was an opportunity for an investor who had already decided what to do, and a crisis for one who had not.
Cash without that job is not dry powder. It is a deferred decision earning minus 1.29 per cent, and the deferral almost always runs longer than anyone intends, because there is never a morning when the news makes the decision obvious. If the plan is to wait for clarity, look at the first chart again. Nearly a third of the last four and a half years has printed above 150. On the evidence, there is no "after" to wait for.
What I am doing about it
These are portfolio construction principles rather than recommendations to any particular person, and the right settings depend entirely on the client, their horizon and their circumstances.
- Measure risk as permanent impairment, not as volatility. Volatility is survivable if the selection is sound, because you keep compounding through it. Permanent loss of capital is not recoverable. A low tracking error against a concentrated benchmark is not low risk.
- Interrogate the passive core rather than assuming it. Roughly 45 per cent of the S&P 500 now sits in technology and communication services. If that is the core, the core is not doing the job it was assigned, and the satellites are not hedging what the client is actually exposed to.
- Budget liquidity against the dislocation you intend to buy, not only the lock-up you can tolerate. A portfolio that is 40 per cent illiquid has not simply accepted gate risk. It has given up the ability to act on most of what the next decade will produce.
- Write the buy list before you need it. Named asset, observable trigger, size, source of funds, and the circumstance in which you would not execute anyway. Reviewed quarterly, actioned or documented within five business days of a trigger. It is the highest-value habit available to a long-horizon investor and it costs nothing but discipline.
- Make the rebalancing policy explicit, dated and mechanical. Rebalancing sells what has run and buys what has fallen. In a volatile, mean-reverting market that is a source of return, and the harvest is largest in exactly the environment that makes executing it hardest. A rule adopted during a drawdown is not a rule, it is an opinion.
- Read the deed, not the fact sheet, on anything semi-liquid. Every gate imposed in Australian private credit in August 2026 followed elevated redemption activity, not a credit event. A fund does not need to be in distress for a suspension clause to bite. It needs enough investors to ask for their money at the same time.
- Treat the currency hedge as a position rather than an accident of which product was on the platform. Set the ratio, size it, and review it annually.
What would change my mind
A view without falsifiers is just a belief, so here is what would make me retire the argument above. I review these quarterly.
- The Geopolitical Risk Index annual average falls below 110 for two consecutive calendar years.
- The rolling stock and bond correlation turns reliably negative for eight consecutive quarters.
- Interstate conflict counts fall back to three or fewer and hold there for two years.
- Developed market inflation returns sustainably to target with policy rates below neutral.
I should also be clear about what I hold loosely. I do not know the timing of anything: not the end of the conflict, not the peak in rates, not the turn in the US dollar. Everything in the section above is deliberately built so that it does not require me to. It is also entirely possible that this market has further to run and that an investor who de-risks on the strength of this piece will regret it. That is precisely why the conclusions are about construction and process rather than about exposure.
Where this lands
If a large cash balance has been sitting in the "decide later" column, the useful exercise is not to guess where the market goes next. It is to work out three things: what that balance is costing you each year after tax, what job you want it to do, and what would have to happen for you to deploy it. Written down, in that order, before the next headline.
That is the kind of work I do with clients, sized to each person's circumstances and wholesale eligibility. It is a conversation, not a product. If you would like to see where the broader market sits today, the Australia Market Valuation dashboard is updated regularly.